Building a Wardley Map: Step by Step
A Wardley Map is a powerful tool for strategic thinking. But staring at a blank canvas with two axes can feel overwhelming. This guide walks you through the process of building a map, step by step. We use a deliberately non-technical example, a bathroom renovation, to show that the principles are universal. Every strategic pattern you find in this bathroom applies to IT platforms, AI adoption, and enterprise transformation.
Step 1: Define Purpose and Perspective
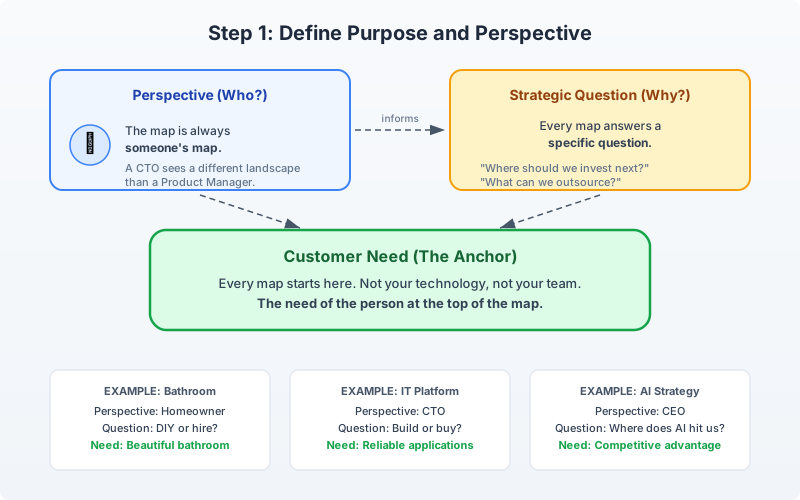
Before placing a single component, answer three questions.
Who is looking at this map? A map is always someone’s map. A CTO mapping an IT platform sees different components than a Product Manager mapping the same platform. The perspective shapes what appears on the map and what does not.
What strategic question are you trying to answer? A map without a question is a decoration. Good questions are specific: “Should I renovate the bathroom myself or hire someone?” “Which parts of our platform can we buy as commodity?” “Where does AI change our value chain?”
Who is the customer? Every map anchors at the top with a customer need. Not your need, not your technology: the need of the person your work ultimately serves. For the bathroom, the need is simple: a beautiful, functional bathroom. For an IT platform, it might be: fast, reliable applications. The customer need is the anchor. Without it the map drifts.
These three elements, perspective, question, and customer need, form the purpose of the map. Get them right and the rest follows naturally. Get them wrong and you will build a pretty picture that answers the wrong question.
Step 2: Build the Value Chain
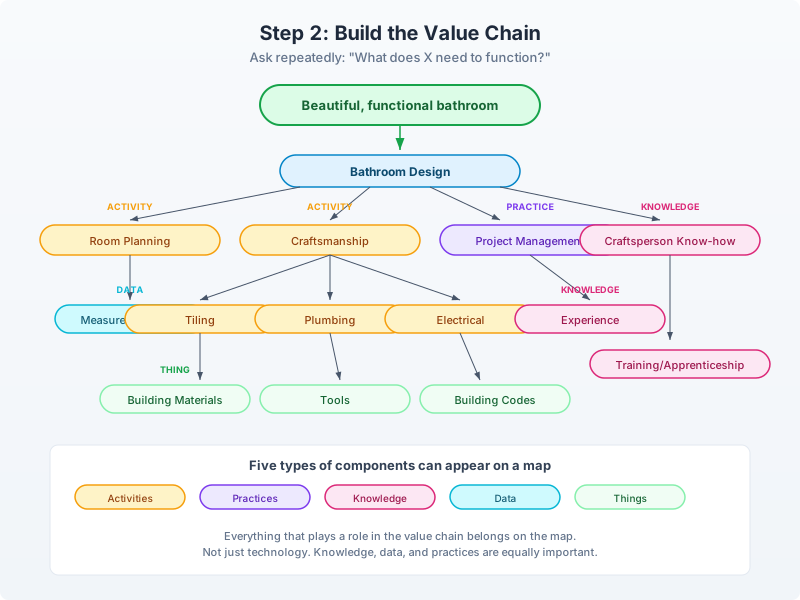
The value chain emerges from a single, repeated question: “What does X need to function?”
Start with the customer need at the top: “A beautiful, functional bathroom.” What does that need? A bathroom design. What does the design need? Room planning, which needs measurement data. Craftsmanship, which needs tiling, plumbing, and electrical work. Craftsperson know-how, which needs training and experience. Project management, which needs experience of what can go wrong. Building materials, tools, and building codes.
Each answer becomes a component on the map. Stop when you have 8 to 12 components. More than that and the map becomes noise. Fewer and you are missing something important.
Five Types of Components
Not everything on a map is a technology or an activity. Five types of components can appear:
Activities are things that get done: tiling, plumbing, installing electrical wiring. In IT: deploying code, running tests, processing transactions.
Practices are how work is organized: project management, quality control, agile development. They are often invisible but critical.
Knowledge is what people carry in their heads: craftsperson know-how, the experience of what can go wrong during a renovation, domain expertise. Knowledge components are frequently the most strategic elements on a map because they are hard to acquire and hard to replace.
Data are the facts that inform decisions: room measurements, material lists, quotes, usage metrics, customer analytics. Data components often sit lower on the value chain but drive the quality of everything above them.
Things are physical or digital artifacts: building materials, tools, servers, software packages.
The bathroom renovation map includes all five types. The same is true for any map worth building. If you find only activities on your map, you are probably missing the knowledge and data that make or break your strategy.
Step 3: Position Components on the Axes
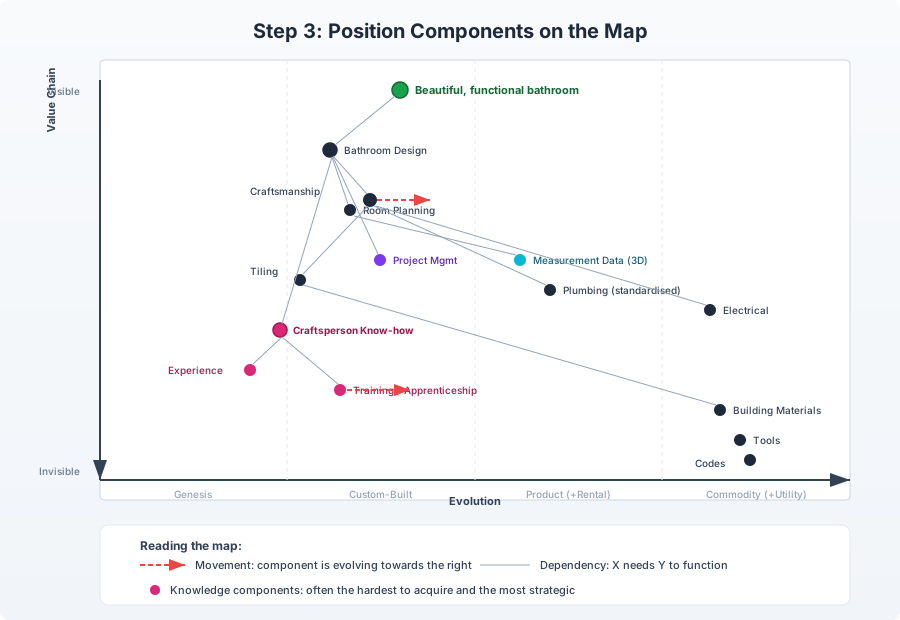
The Y-Axis: Visibility in the Value Chain
The vertical axis represents the value chain from the customer’s perspective. At the top sits what the customer sees and cares about. At the bottom sits what is invisible to the customer but necessary for the system to work.
The customer sees and cares about the bathroom design. They do not see the building codes or the plumber’s training. But without those invisible components, the visible ones cannot exist.
The X-Axis: Evolution
The horizontal axis is the heart of Wardley Mapping. It represents the evolution of each component through four stages.
Genesis: novel, uncertain, requires exploration. Nobody has done this before. Example: a smart shower system with AI temperature control.
Custom-Built: understood enough to build for specific needs, but still unique. Example: a handcrafted mosaic tile design for your specific bathroom.
Product (+Rental): mature enough to buy or rent from a market of providers. Example: a prefab bathroom pod that Marriott installs in its hotels.
Commodity (+Utility): standardized, available as utility. Example: standard fittings, copper pipes, electricity.
Four orientation questions help with positioning:
- Is there a market for this? No = left, yes = right.
- Could we switch providers easily? Hard = left, easy = right.
- Do we understand it well enough to describe it to anyone? Barely = left, everyone gets it = right.
- How much uncertainty is there? A lot = left, very little = right.
Positioning is never precise. It is always a judgment call. That is fine. The value lies not in accuracy but in the conversation it triggers. When two people disagree about where a component belongs, you have found a strategic insight.
Step 4: Read the Map Strategically
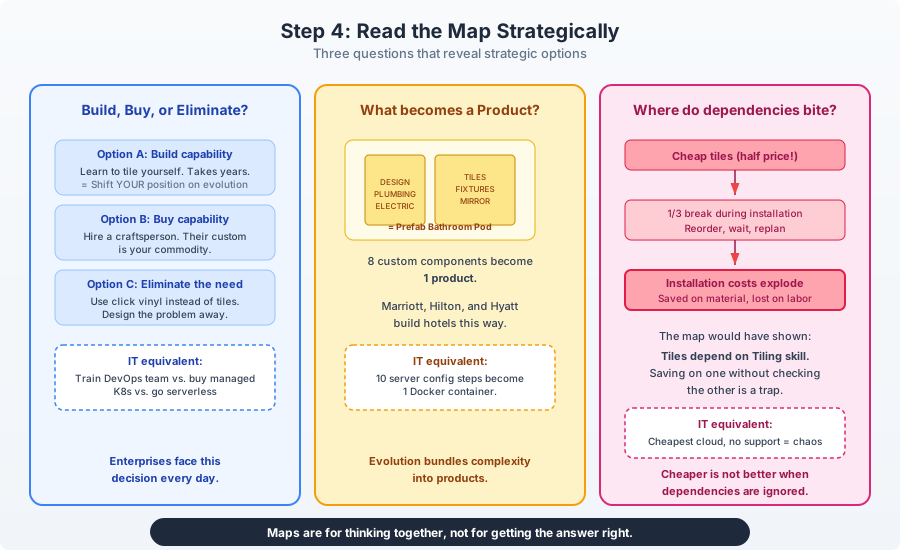
A completed map is not a deliverable. It is the beginning of a strategic conversation. Three patterns are immediately visible.
Build, Buy, or Eliminate?
Look at “Craftsperson Know-how” on the bathroom map. It sits firmly in Custom territory. If you are not a skilled craftsperson, you face three options.
Build the capability. Take courses, watch tutorials, practice. This shifts your personal position on the evolution axis to the right. It takes years and costs time. In enterprise terms: train your DevOps team on Kubernetes.
Buy the capability. Hire a craftsperson. Their custom-built skill is, from your perspective, now available as a product you purchase. You skip the evolution by leveraging someone else’s journey. In enterprise terms: buy managed Kubernetes from a cloud provider.
Eliminate the need. Choose click-vinyl flooring instead of tiles. The design choice removes the dependency on tiling skill entirely. In enterprise terms: go serverless and eliminate the infrastructure management problem.
Enterprises make this decision daily. The map makes the options visible.
What Becomes a Product?
The bathroom map shows something fascinating when you zoom out. What if you do not evolve individual components but the entire bathroom? Companies like SurePods and Durapods produce complete prefabricated bathroom pods. Design, plumbing, electrical, tiling, fixtures, mirror: everything assembled in a factory and delivered as a single unit. Marriott, Hilton, and Hyatt build hotels this way.
On the map, eight custom components collapse into a single product. This is exactly what happens in IT when ten manual server configuration steps become one Docker container, or when an entire CI/CD pipeline becomes a GitHub Actions workflow.
Evolution bundles complexity into products. Recognizing when this is happening, or about to happen, in your own value chain is a strategic superpower.
Take this one step further: could there be “Bathroom as a Service”? Consider co-living spaces where the bathroom is maintained, renovated, and updated without the resident lifting a finger. Or commercial building operators who outsource sanitary facilities as a full-service contract. When something reaches commodity, a service model almost always emerges on top of it. Wardley calls this a climatic pattern.
Where Do Dependencies Bite?
A cautionary tale: someone found tiles at half price. Great deal. Except the cheap tiles were so brittle that a third of them broke during installation. The tiler had to reorder, wait, replan. The installation cost exploded. The savings on material were wiped out, and then some, by the increased labor cost.
The map would have made this risk visible. Building materials (commodity) connect via a dependency line to tiling (custom skill). Optimizing one component without examining the dependency to another is a trap. The connection line on the map is a warning system.
The IT equivalent: choosing the cheapest cloud hosting without considering the support, migration effort, and workarounds the team will need. Cheaper is not better when dependencies are ignored.
Starting Your First Map
Take 15 minutes. Pick a real topic: your team, your product, a decision you are facing.
- Write one customer need at the top.
- Ask “What does this need?” and work your way down.
- Stop at 8 to 12 components.
- Slide components left or right based on your gut feeling about their evolution stage.
- Look at what surprised you.
The map will be wrong. That is the point. As Simon Wardley says: a map is always wrong the moment you look at it. Its value is not accuracy but shared understanding. It forces conversations that matter: “What would this mean for us? Where should we invest? Which assumptions are we making?”
Build the map. Then talk about it with someone. The strategic insight is in the conversation, not in the diagram.
What Comes Next
Building a map is the first of four capabilities in Wardley’s strategy cycle.
Map (this guide): Where do we stand? What depends on what?
Climate (Climatic Patterns): What forces act on our map? What moves without our intervention? Why does everything evolve to the right?
Doctrine (Doctrine): What principles should guide our decisions? Where does our organization stand on the fundamentals?
Gameplay: What specific strategic moves can we make? How do we act on what the map reveals?
The map is the landscape. Climate is the weather. Doctrine is the marching orders. Gameplay is the tactical moves. You just learned to build the landscape.
Based on the work of Simon Wardley. See Wardley Mapping and Wardley Map for background. For the original material, see Wardley Maps on Medium and Learn Wardley Mapping.